Market Overview
As of February 2023, the housing market in South Carolina witnessed a 4.2% increase in home prices from the previous year, with a median selling price of $342,500. However, the number of homes sold in February this year decreased by 24.3% compared to last year, with only 4,563 homes sold. This number was down by 6,030 homes from February last year. Additionally, the median days on the market increased by 27 year over year, reaching 78 days.
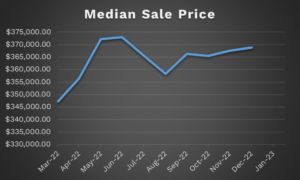
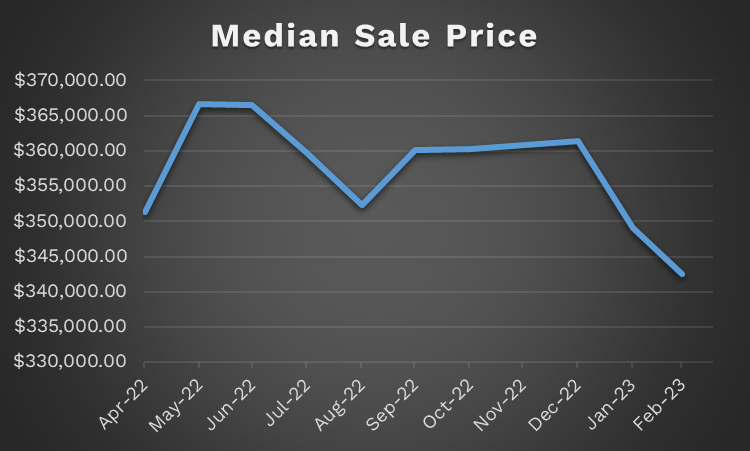
Median Sale Price
The median sale price for homes in South Carolina saw a decrease of 1.89% between January ($349,100) and February ($342,500) of 2023, reaching its lowest point for the previous 11 months. From the median sale price peak in May of 2022 of $366,700, sale prices are down $24,200, or 6.6%. Overall, February was confirmation of a declining trend in median sale prices, indicating homes are becoming more affordable.
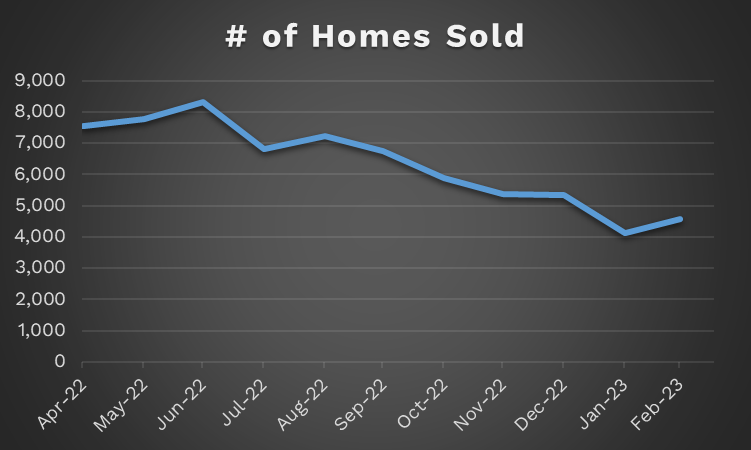
Number of Homes Sold
We saw a slight uptick in homes sold in February compared to January, with 430 more homes sold, totaling 4,563, coming off the previous year’s record low in January. Looking at a moving average for the previous year, home sales are still on a downward trend, although, February did offer a glimmer of hope for things to pick up.
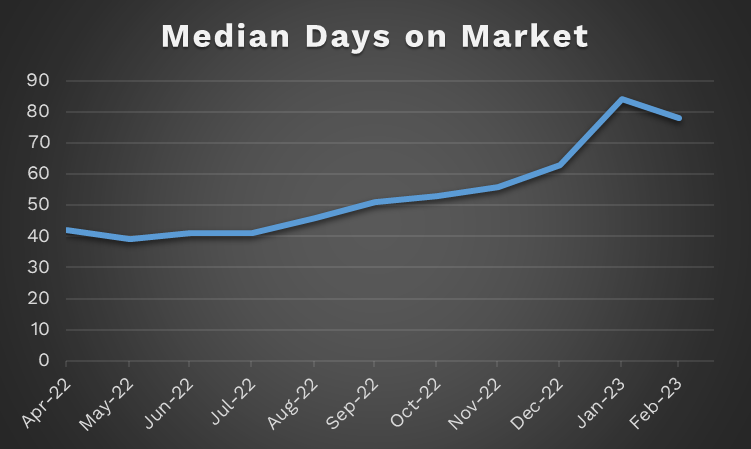
Median Days on Market
In a breath of fresh air for home sellers, the Median days homes spent on the market in South Carolina decreased 7.14% from 84 to 78 between January and February, finally abating the strong upward trend of previous months. This is an indication that, in some cases, homebuyers are starting to compete for homes again and, indeed, we are seeing cases where multiple offers are being submitted.
Supply
In February, we saw a slight increase in the number of homes for sale in South Carolina. However, this was outpaced by the number of homes sold, giving us a decrease in the months of supply compared to January. This further illustrates an increase in buyer activity as well as the beginning of the restoration of a healthy balance between buyer and seller activity.
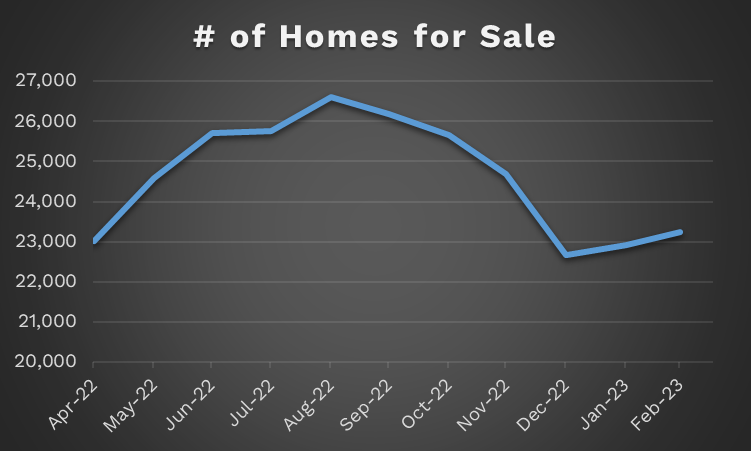
Number of Homes for Sale
The number of homes for sale steadily continued their increase from January to February, rising to 1.37% to 23,246.
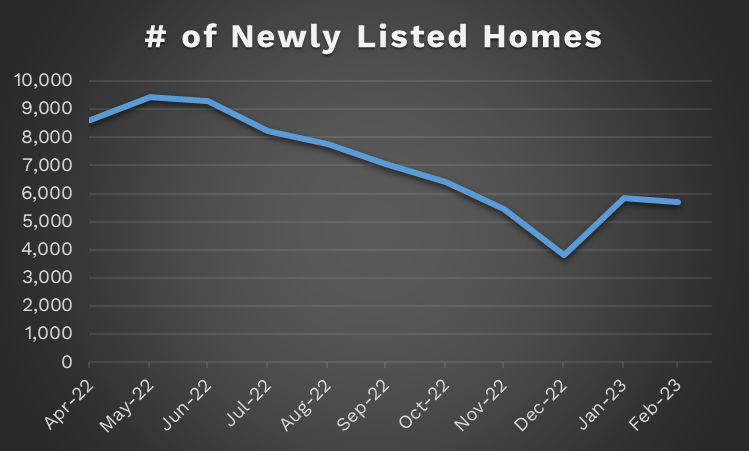
Number of Newly Listed Homes
New listings are slightly down from January after a sharp bounce in January off of a strong downward trend. We are currently up 49% off of December’s low, but still down 39% off of last year’s high.
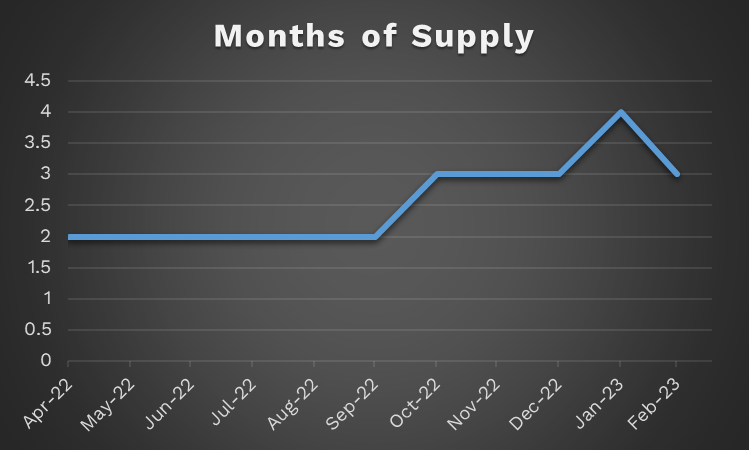
Months of Supply
At the current rate of home selling, there are approximately 3 months of supply in the market. That’s 3 times as much as March 2022. Despite the slight decrease in February, the overall trend in supply is still moving up as the market continues to normalize with buyers and sellers reaching a healthy equilibrium of control.
Demand
The number of homes sold above list price and the sale-to-list-price have flattened out on the troughs over the past couple of months, while the number of homes with price drops appears to somewhat be trending down. The theme for February seems to be that sellers are being more reasonable and buyers are responding, as expected, with more activity.
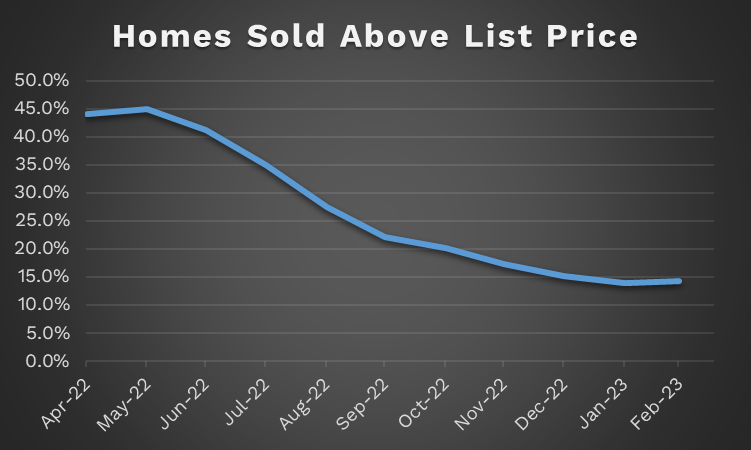
Homes Sold Above List Price
14.4% of homes in February sold above their list price. That’s a 2.9% increase from January , where 14% of homes sold above list price and a 68% decrease from 2022’s peak in May where nearly half of all homes sold above their listing price. This highlights a return to a healthy amount of competition, where its not the buying frenzy that it once was, but despite a decline in the number of homes with price drops, buyers are still engaged.
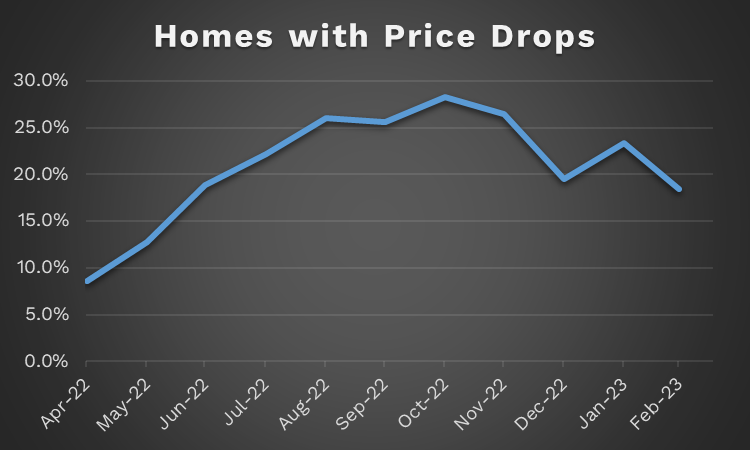
Homes with Price Drops
Although there aren’t a lot of homes selling above list price, there were 21% fewer homes, in February, with price drops than January. Again, this points to a balancing of control in real estate transactions between buyers and sellers.
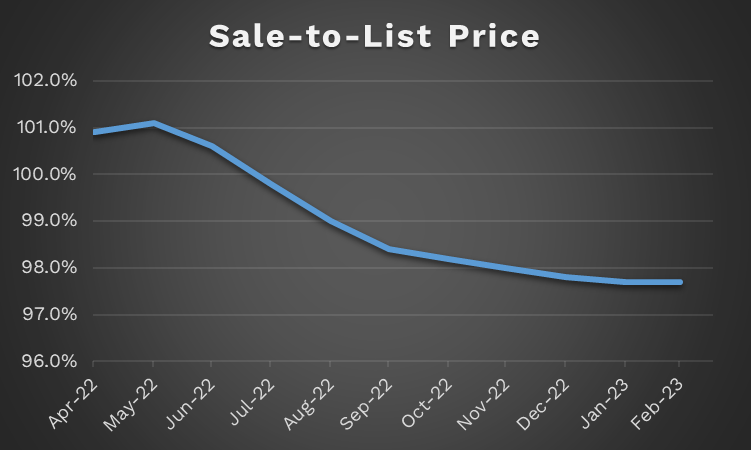
Sale-to-List-Price
The average sale-to-list-price was 97.7% in February. When looked at together with the decrease in homes with price drops, we can see that sellers may be becoming more reasonable with their initial pricing according to buyer expectations.
Key Takeaways & Conclusion
Overall, the theme for the housing market in February seems to be that sellers are adapting to the previous months’ dramatic buyer exodus by being more reasonable with pricing and starting to come to terms with the fact that the multiple offer frenzy days are over. In return, buyers are slowly, but surely, returning to the market.
Data source: Redfin