Market Overview
As of December 2022, the median home price in South Carolina had risen by 10.8% compared to the previous year, reaching $368,800. However, the number of homes sold on average decreased by 33.9% year over year, with only 5,036 homes sold in December 2022 compared to 7,617 homes sold in December 2021. Additionally, the median number of days homes spent on the market increased by 11 days year over year to 64 days. The following data illustrates a shift in negotiating power from sellers to buyers.
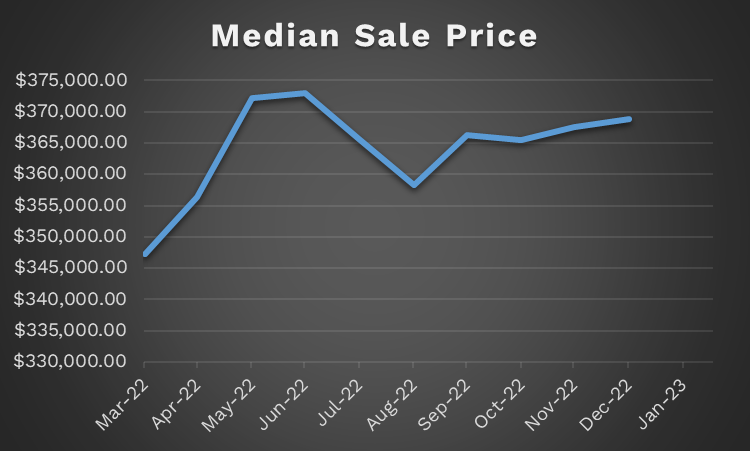
Median Sale Price
The median sale price for homes in South Carolina saw an increase of 0.3% between November ($367,000) and December ($368,800) of 2022. From the median sale price peak in June of 2022 of $373,000, sale prices are down $4,200, or 1.14%. Overall, we can see a flattening trend in median sale prices, indicating a potential increase in affordability on the horizon.
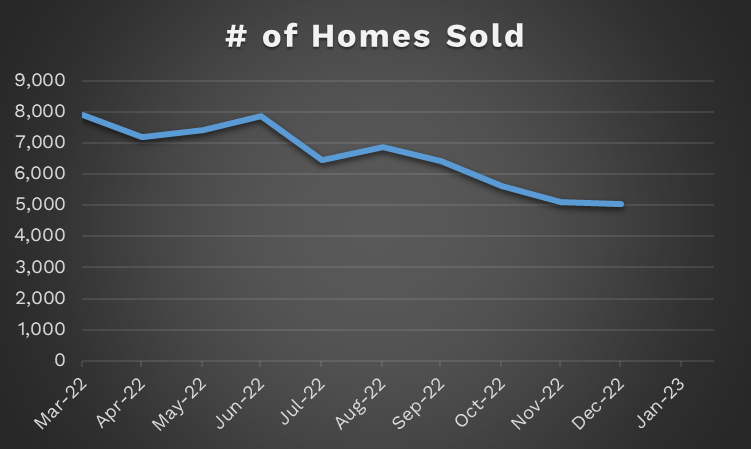
Number of Homes Sold
The number of homes sold in South Carolina saw a negligible decrease between November and December of 2022, with only 59 less homes sold in December. Throughout 2022, we saw a downward trend of sold homes with 7,897 homes sold in March and just 5,036 homes sold in December, a dramatic decrease of 36%.
Median Days on Market
Between November and December of 2022, the Median days homes spent on the market in South Carolina increased 14.3% from 56 to 64. Between May and December, the increase is 64.1%. 2022 saw a strong increase in the amount of time homes spent on the market.

Supply
Although the number of homes for sale has been decreasing since August, fewer buyers are entering the market, causing an increase in supply.
Number of Homes for Sale
The number of homes for sale in South Carolina decreased sharply from November to December of 2022, 8.5%. The decrease from last year’s high was 15.2%, where in August, there were 25,835 homes for sale.

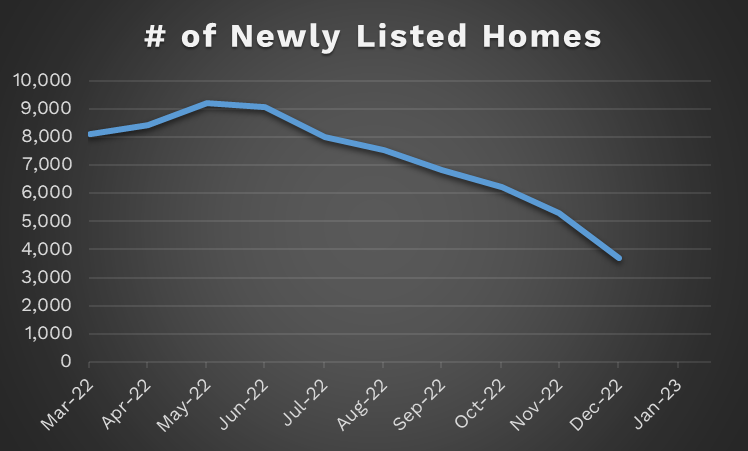
Number of Newly Listed Homes
The number of new listings fell a whopping 30% from November to December 2022. This was par for the course for the declines which started after May’s peak of 9,224 new listings. Now, in December, there were only 3,710 new listings, a decrease of 60%.
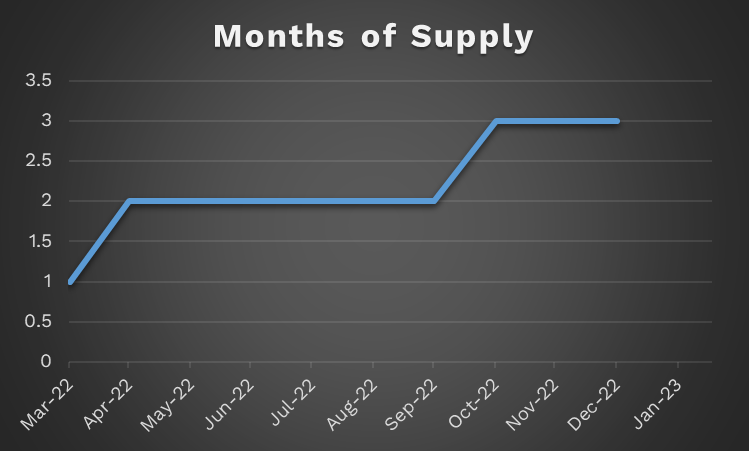
Months of Supply
At the current rate of home selling, there are approximately 3 months of supply in the market. That’s 3 times as much as March 2022. While, technically, still seller’s market territory, the writing is on the wall. Supply is increasing and buyers are gaining control.
Demand
In the current real estate market, there has been a, to say the least, noticeable decrease in the number of homes selling above the listed price. There has also been an increase in the number of homes with price drops. Additionally, there has been a decline in the sales-to-list price ratio, indicating that sellers are having to reduce their prices to attract buyers.
These trends suggest that the market is becoming more favorable for buyers, who are now able to negotiate lower prices and may have more options to choose from. At the same time, sellers may need to adjust their expectations and be more flexible with their pricing to remain competitive.
Overall, this real estate market appears to be shifting towards a more balanced state, with a greater balance of power between buyers and sellers. It will be interesting to see how these trends continue to develop in the coming months and what impact they have on the overall health of the housing market.
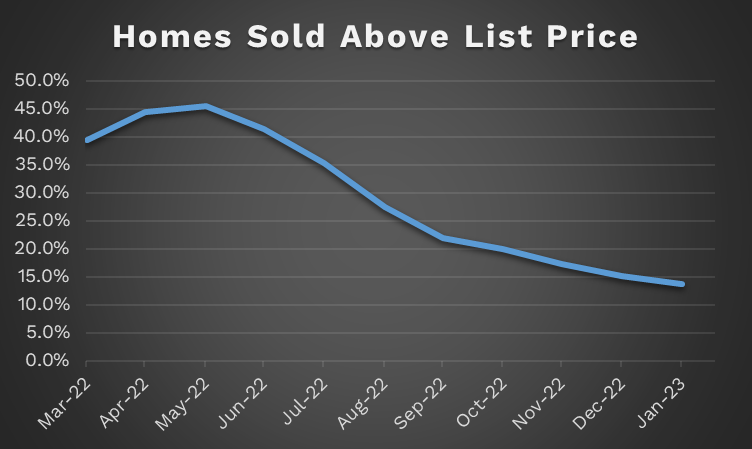
Homes Sold Above List Price
13.7% of homes in January 2023 sold above their list price. Thats a 9.2% decrease from December 2022, where 15.1% of homes sold above list price and a 70% decrease from 2022’s peak in May where nearly half of all homes sold above their listing price. This highlights a decrease in competition, where last year’s multiple offer scenarios have dwindled.
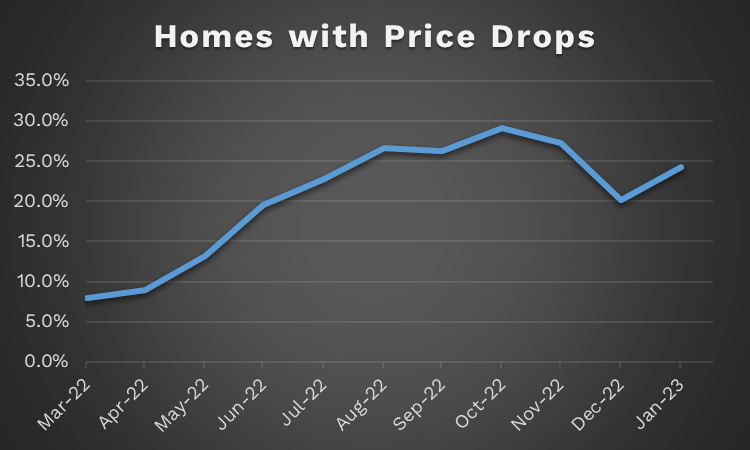
Homes with Price Drops
Inversely to homes selling above list price, homes with price drops have been increasing the past several months. From March 2022 where 8% of listed homes saw price drops, now 24.3% of sellers have dropped their listing price. That’s over a 200% increase.
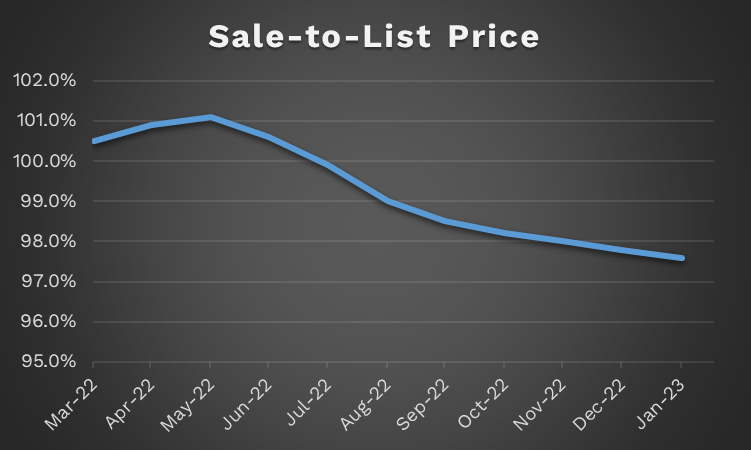
Sale-to-List Price
The average sale price divided by the average list price in January was 97.6%. Buyers have been talking sellers down, increasingly, off their listing price in this market since May of 2022, where the average sale price was 1.1% higher than the average list price.
Conclusion
We can infer, based on all of the above data and the prevailing market sentiment, that we are in a normalizing market. The early half of 2022 was an extreme example of a seller’s market. Those days are behind us and buyers are gaining more flexibility in real estate transactions. Despite mounting pressure to pick up a downward pace, home sale prices are still trending relatively sideways. Sale price increases have slowed, however, indicating a potential trend reversal on the horizon.
Data Source: Redfin